
PerfView
Optimize apps with ETW and CLR insights
Description
Use PerfView to optimize your applications by gaining valuable insights from ETW traces and CLR memory dumps. This tool lets you collect, investigate, and view performance data in a user-friendly environment, concentrating on CPU performance metrics. Easily analyze ETL files and heap information to identify optimization opportunities, reduce latency, and enhance overall application responsiveness, empowering you to deliver faster, more efficient software.
Screenshots
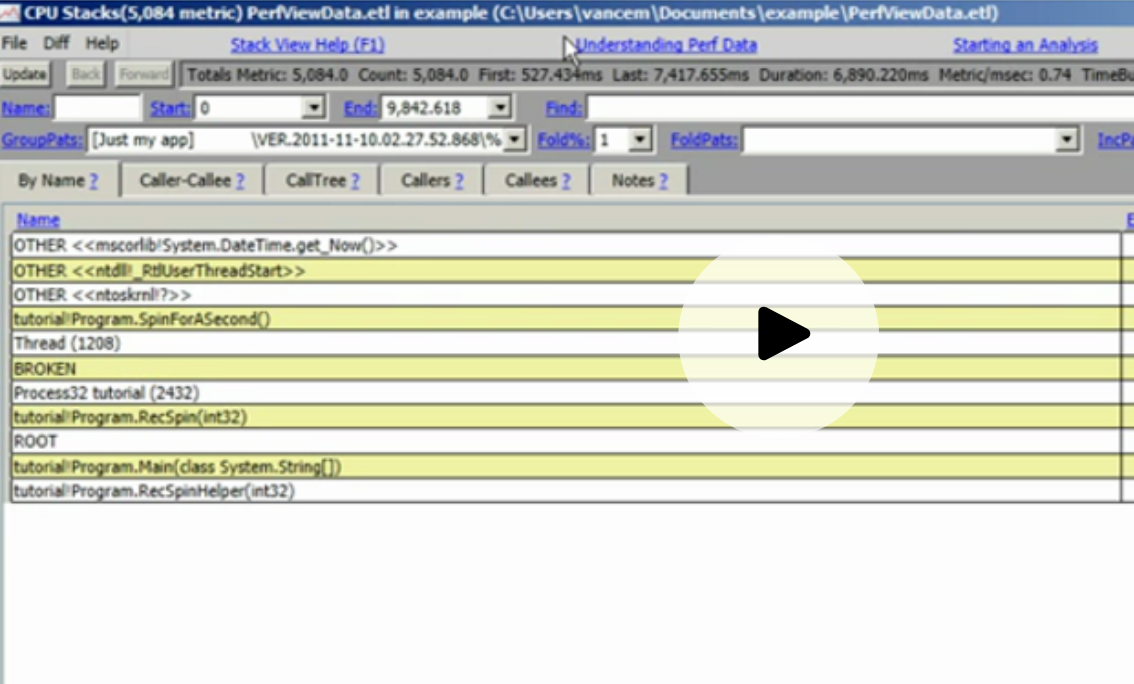
Click to view full size